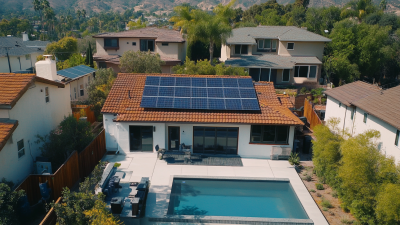
Top Solar Panel Manufacturers for Global Buyers
Choosing among the top solar panel manufacturers requires more than comparing wattage and advertised prices. Global buyers must examine production quality, warranty terms, certifications, financial stability, and after-sales support. A panel performing well in northern Europe may respond differently in desert heat or humid coastal conditions. Real projects reveal these differences.
This guide evaluates established manufacturers through practical purchasing criteria. It considers module efficiency, temperature coefficients, degradation rates, factory audits, and supply consistency. It also examines whether technical documentation is clear and replacement procedures are realistic. That matters when a damaged module sits in a remote warehouse or utility site.
Experience helps.
Buyers should request independent test reports and verify certification numbers before signing contracts. They should also compare the manufacturer’s warranty with the installer’s responsibilities. Some suppliers offer impressive guarantees, yet local service remains limited. That weakness can increase downtime and unexpected labor costs.
The phrase Solar Solar Panels may appear in search data, but product quality should guide every decision. Reputable manufacturers publish traceable specifications and maintain transparent quality controls. Still, no supplier is perfect. Manufacturing delays, policy changes, and material shortages can affect even respected brands. This guide acknowledges those uncertainties rather than promising effortless procurement.
Readers will find a balanced framework for comparing manufacturers across regions and project types. Residential buyers may prioritize appearance, monitoring, and simple installation. Commercial and utility buyers may focus on bankability, volume capacity, and long-term performance. The strongest choice depends on site conditions, budget, risk tolerance, and service availability. Carefully checking these details can protect both investment value and future energy output.
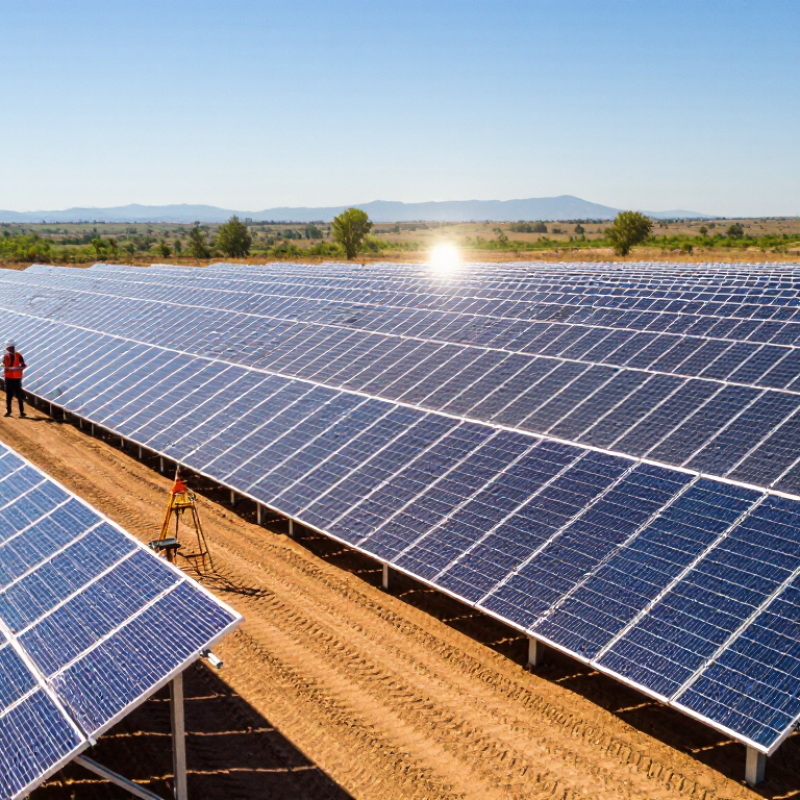
Global PV Baseline: 447 GW Added and 1.6 TW Installed in 2023 (IEA PVPS)
The 2023 global PV baseline changed purchasing conversations. IEA PVPS reports 447 GW of solar capacity added during the year, bringing installed capacity to about 1.6 TW. These figures show extraordinary deployment, not automatic quality. Details matter. Buyers should ask how manufacturers manage materials, cell consistency, factory testing, and shipment protection. On a project site, one cracked module can delay a row, crew, or inspection. Clear serial-number tracking connects each panel with production records and test results. Independent certifications matter, but paperwork should match physical performance. Ask for degradation data, warranty conditions, and evidence from comparable climates.
Global buyers also need to compare manufacturers against local grid rules and fire requirements. A panel designed for a dry desert may behave differently under coastal humidity or heavy snow. Examine temperature coefficients, mechanical-load ratings, and documented quality-control procedures. Supply capacity deserves attention after such rapid global expansion. A large order helps only when deliveries remain consistent. Factory audits, sample testing, and third-party inspections can reduce unpleasant surprises. Quality is uneven. No checklist removes every risk. IEA PVPS data describes market scale, while each buyer must verify current factory evidence, contract terms, and after-sales support. The numbers are powerful, yet they can hide uneven execution.
Manufacturer Categories: Mono-PERC, TOPCon, HJT, and Thin-Film Technologies
Top Solar Panel Manufacturers for Global Buyers
Manufacturer Categories: Mono-PERC, TOPCon, HJT, and Thin-Film Technologies
Mono-PERC panels remain widely available because their production lines are mature and their pricing is comparatively predictable. They perform well on residential roofs, commercial buildings, and utility-scale sites with limited shading. Buyers should inspect degradation guarantees, back-contact quality, and independent test results rather than trusting efficiency figures alone. Small details matter.
TOPCon panels usually deliver higher efficiency and stronger bifacial performance than standard Mono-PERC modules. Their n-type cells can reduce some light-induced degradation, which helps in hot, high-irradiance regions. However, factory consistency varies. Ask manufacturers for third-party certification, production tolerances, and measured data from comparable climates. A lower quoted price may hide weaker glass, connectors, or quality-control processes.
HJT technology combines crystalline silicon with thin amorphous layers, offering strong temperature performance and useful output in changing weather. It can suit rooftops where every square meter matters, though manufacturing costs and supply availability deserve careful review. Thin-film modules are lighter and can perform steadily under diffuse light, making them practical for large roofs, curved surfaces, or structures with limited load capacity. Their lower power density may require more installation space. In real projects, the best category depends on climate, roof strength, maintenance access, and financing terms. I have seen technically impressive panels underperform when installation conditions were overlooked. Manufacturer history helps, but field evidence matters more.
| Manufacturer Category | Cell Architecture | Typical Commercial Module Efficiency | Typical Module Power Range | Typical Temperature Coefficient of Pmax | Typical Bifaciality | Typical First-Year Degradation | Typical Annual Degradation After Year One | Best-Fit Project Conditions | Key Buyer Considerations |
|---|---|---|---|---|---|---|---|---|---|
| Mono-PERC | Monocrystalline silicon with passivated emitter and rear cell structure | 19%–22.5% | 350–600 W | Approximately −0.34% to −0.38%/°C | Approximately 70%–80% | Up to approximately 2% | Approximately 0.40%–0.55% | Residential rooftops, commercial rooftops, utility projects, and markets where mature supply chains are important | Usually offers a strong balance of cost, efficiency, availability, and established installation practices; verify current product generation because newer technologies may provide higher energy yield |
| N-Type TOPCon | N-type crystalline silicon with tunnel-oxide passivated contact technology | 21%–23.5% | 400–700 W | Approximately −0.29% to −0.32%/°C | Approximately 80%–85% | Up to approximately 1% | Approximately 0.30%–0.40% | Large rooftops, utility-scale sites, hot climates, and projects requiring higher power density | Higher efficiency and lower degradation than many legacy P-type products; compare temperature coefficients, mechanical loads, warranty terms, and long-term supply capacity |
| HJT | Heterojunction structure combining crystalline silicon with thin amorphous-silicon passivation layers | 21%–24% | 400–730 W | Approximately −0.24% to −0.30%/°C | Approximately 85%–95% | Up to approximately 1% | Approximately 0.25%–0.35% | High-temperature regions, bifacial utility projects, constrained rooftops, and installations focused on lifetime energy yield | Very strong temperature behavior and bifacial performance; assess module dimensions, weight, installation compatibility, procurement volume, and price premium |
| Thin-Film | Semiconductor absorber deposited on glass, metal, or flexible substrate; includes several material families | Approximately 10%–19% | 100–500 W per module or panel format | Approximately −0.20% to −0.30%/°C | Usually 0%–10% for standard opaque products | Technology- and product-specific; commonly assessed with a stabilized output rating | Often approximately 0.20%–0.50%; verify the product warranty | Large ground-mounted sites, hot climates, low-load roofs, visually sensitive projects, and applications requiring specialized form factors | Lower power density may require more land or roof area; evaluate stabilized efficiency, substrate type, mounting method, recycling requirements, and local service capability |
Ranking Global Suppliers by Shipments, Capacity, and Bankability in 2023
Top Solar Panel Manufacturers for Global Buyers
Ranking Global Suppliers by Shipments, Capacity, and Bankability in 2023
In 2023, global solar suppliers competed on shipment volume, production scale, and financial credibility. Shipment rankings often favored manufacturers with strong utility-scale orders and broad distribution networks. However, reported shipments were not always measured consistently. Some figures included wafers, cells, or shipped modules. Buyers should check the definition carefully.
Manufacturing capacity offered another useful comparison. Leading suppliers operated several factories across Asia, Europe, and North America. Their annual capacity sometimes exceeded actual output by a wide margin. That gap matters. Idle lines, changing demand, and factory upgrades can reduce delivery reliability. A practical review should examine usable capacity, regional production, and confirmed expansion dates.
Bankability added a financial perspective. Project developers and lenders commonly reviewed audited statements, debt levels, warranty reserves, and long-term operating history. Independent technical assessments also examined product testing, degradation rates, and quality-control records. A high shipment ranking did not automatically prove stronger bankability. That assumption needs caution.
Data can be imperfect. Public reports may rely on company disclosures, analyst estimates, or shipment surveys. These sources can conflict. Global buyers should compare at least two independent datasets before selecting suppliers. They should also request recent factory audits, sample test results, and warranty terms. The strongest 2023 ranking was not simply a list of the biggest producers. It was a balanced assessment of delivered volume, realistic capacity, and dependable financial support.
Comparing Efficiency, Degradation, Warranties, and LCOE for Global Buyers
For global buyers, module efficiency should be judged beside degradation, warranty strength, and delivered energy. Fraunhofer ISE’s Photovoltaics Report 2024 records leading commercial crystalline-silicon modules above 23% efficiency. Higher efficiency can reduce land, racking, and installation costs, especially on constrained sites. It does not automatically produce the lowest LCOE.
Degradation deserves closer attention. NREL’s 2024 degradation study reports a median annual rate near 0.5% across photovoltaic systems. A 0.3% rate can preserve noticeably more output after 25 years than a 0.8% rate. Check whether the warranty covers power only, or also product defects. Many market warranties now span 25 to 30 years, but exclusions, transfer conditions, and claim procedures vary. Read the small print.
Lazard’s Levelized Cost of Energy analysis, Version 17.0, places utility-scale solar near 29–92 dollars per megawatt-hour, before local financing and grid costs. That range is wide. Freight, taxes, curtailment, replacement parts, and weak irradiation can change the result. In procurement work, I model at least three degradation cases instead of trusting one headline figure. It is less elegant, but more honest. A perfect forecast is impossible. Buyers should also request independent test data, factory quality records, and evidence from comparable climates. Nameplate efficiency looks impressive under glass. Lifetime yield pays the bill.
Solar Module Technology Benchmarks for Global Buyers
Comparison of typical commercial module performance: rated efficiency, first-year degradation, product warranty, and indicative utility-scale LCOE.
Values are technology-level market benchmarks rather than company-specific figures. Efficiency and degradation represent typical commercial ranges, while warranty periods reflect commonly offered product warranties. LCOE is an indicative utility-scale estimate in USD/MWh and varies with solar resource, financing, land, installation cost, storage, and project scale.
Due Diligence: IEC 61215, IEC 61730, Tier-1 Status, and Supply Risks
Global solar buyers should treat manufacturer screening as a technical investigation, not a popularity contest. IEC 61215 tests module design under environmental stresses, including heat, humidity, mechanical loads, and electrical performance. IEC 61730 focuses on safety, covering construction, insulation, fire behavior, and protection against electric shock. Check the certificate’s exact model range. A certificate may not cover every factory, glass type, or power class. Small details matter.
Tier-1 status can support a bankability discussion, but it is not a quality certificate. It usually reflects financing history and project visibility, rather than complete manufacturing excellence. Ask for current test reports, factory locations, audit dates, warranty terms, and serial-number traceability. Inspect sample labels and packaging records. Paperwork can look polished. It can still be incomplete. Buyers should also review degradation data, claims procedures, and the manufacturer’s technical support capacity.
Supply risk deserves equal attention. Confirm the sources of cells, wafers, glass, frames, and junction boxes. A single disrupted input can delay an otherwise ready shipment. Compare lead times under normal and stressed conditions. Check port routes, inventory buffers, replacement-module policies, and insurance responsibilities. Currency exposure and changing trade rules may affect landed cost. Do not rely on one spreadsheet. Reconcile factory statements with independent inspection and contract evidence. Some assumptions will be wrong; documenting them makes correction possible.
Related Posts
-
Navigating Global Quality Standards when Sourcing Solar Panel Solutions
-

Choosing the Right Manufacturer: How to Identify the Best Solar Panel Solutions in the Market
-

Navigating the Future Market Trends of Best Solar Panel Solutions for 2025 and Beyond
-
Understanding the Benefits of Power Smart Solar for Global Buyers
-
Ultimate Guide to Sourcing the Best Powers Solar Solutions for Your Business
-

Smart Power Solar Best Solutions for Global Buyers in 2026